TexFig
A vector plotting utility I created in 2016 with Python and LaTeX.
This utility assists in producing vector plots with Python’s matplotlib plotting library for seamless typesetting in LaTeX documents.
From README.md in the nilsvu/texfig GitHub repository:
TexFig
![]()
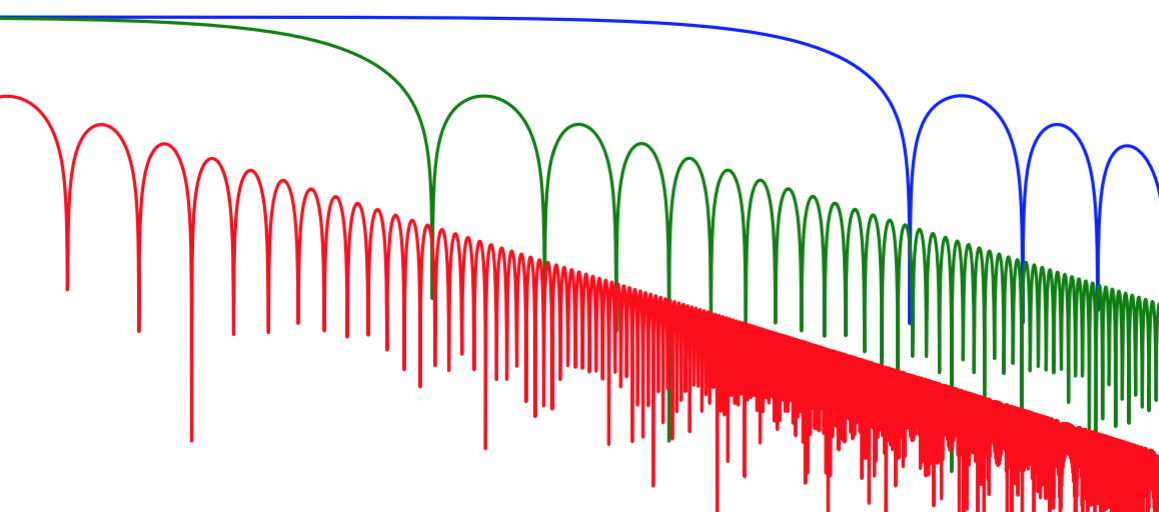
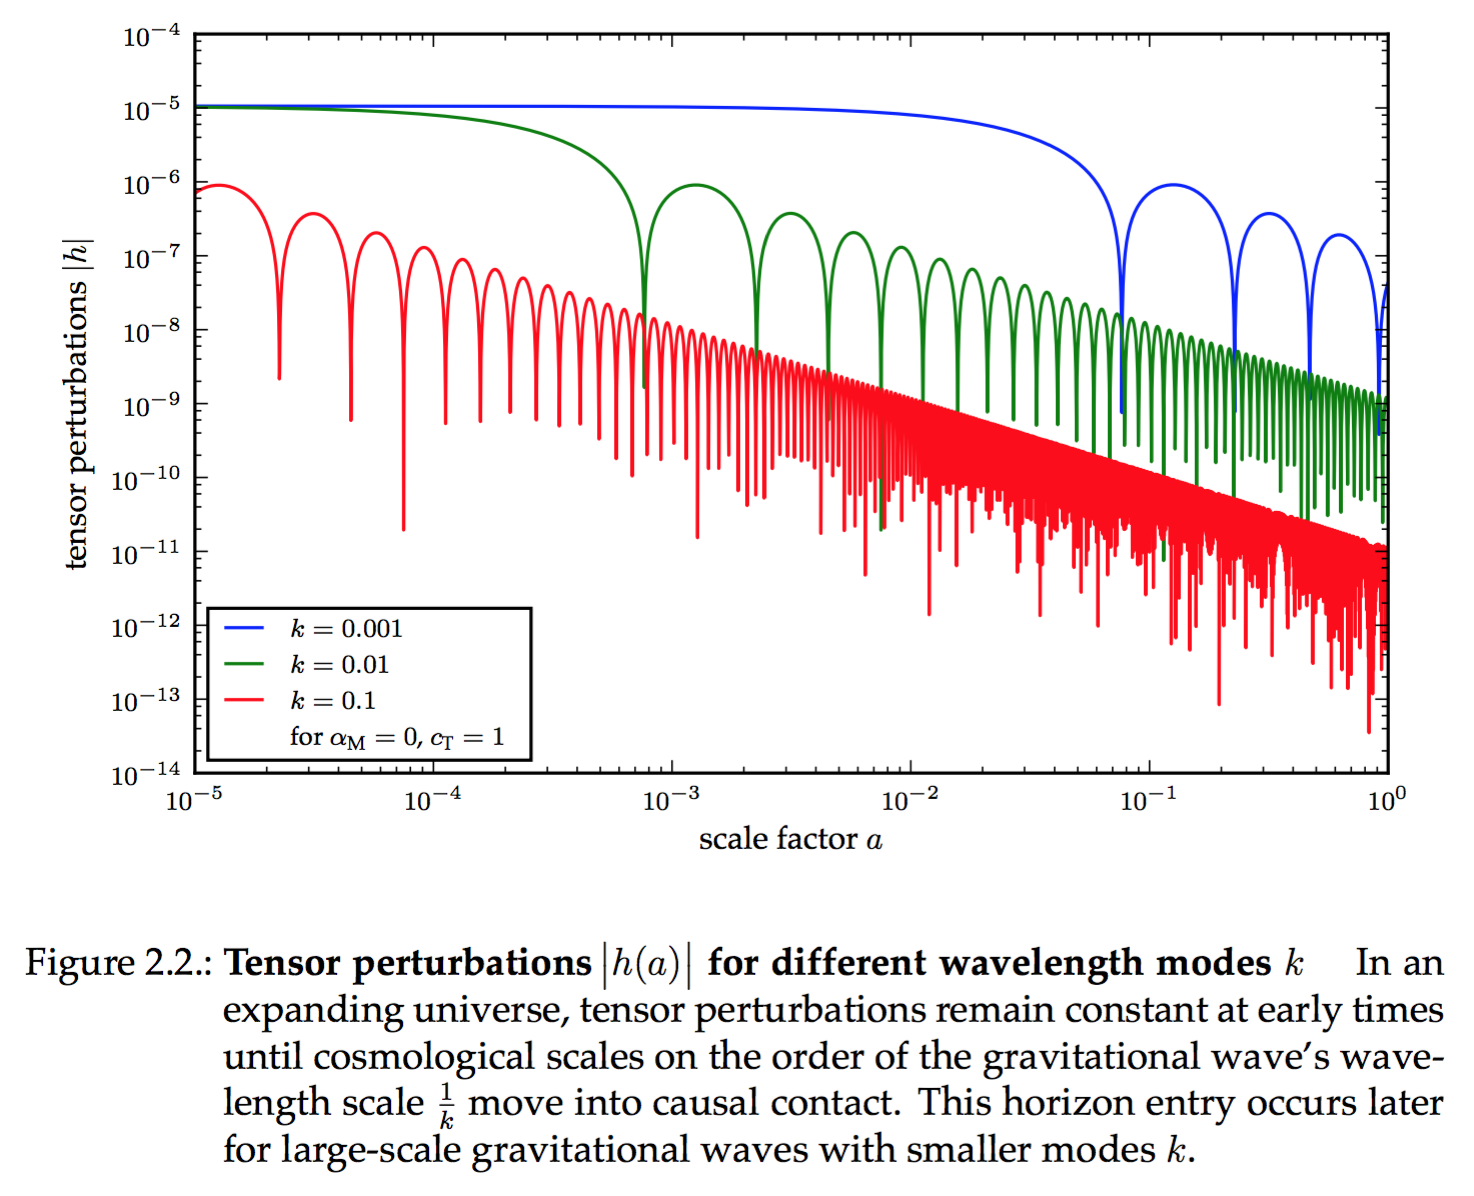
Python’s Matplotlib can save plots as PGF vector files, with text containing LaTeX code and all. LaTeX can render PGF files. Sounds like a perfect match, doesn’t it? (It does. See my bachelor thesis for example plots.)
Why PGF?
- It’s a vector format. No blurry pixel graphics anymore!
- Any text in your plots will be typeset with your document’s native font and style.
- You can use your custom LaTeX
\newcommandmacros in your plots after defining a dummy implementation for them in Python. They will be typeset correctly in your document.
Usage
- Download the repository and run
python example.py
```

to test your Python and LaTeX setup. 2. Copy the `texfig.py` file next to your Python script. It is just some simple setup and utility code for `matplotlib` to get you started, so feel free to edit any configurations within. 3. Use `texfig` to generate PGF plots:

```python
# import texfig first to configure Matplotlib's backend
import texfig  # assuming texfig.py and an __init__.py is in the directory
# then, import PyPlot as usual
import matplotlib.pyplot as plt

# obtain a nicely configured figure from texfig
fig = texfig.figure()
# plot as usual
plt.plot(range(10))
# save your plot as both a PGF file (for inclusion in LaTeX) and a PDF file (for preview only)
texfig.savefig("example_plot")
```

You can adjust the settings in `texfig.py` to your liking. In particular, you may want to set the `default_width` to your LaTeX `\textwidth` (in inches). In the `pgf.preamble` list you can also define any macros that you have implemented in your LaTeX document and that you wish to use in your plots. Don't worry about implementing them correctly here, since they are rendered by your LaTeX document later anyway.

> Make sure that no call to change matplotlib backends precedes the `import texfig` statement, and do not change backends afterwards either. In particular, refrain from using `%matplotlib inline` configurations in Jupyter Notebooks.
-
Now
\usepackage{pgf}and\inputthe PGF file in your LaTeX document:% in the preamble \usepackage{pgf} % somewhere in your document \input{example_plot.pgf} -
Admire the beauty of LaTeX vector plots.
Hint: If your PGF plots end up slowing down your LaTeX compile times too much, consider omitting the PGF rendering in
draftmode like so:% in the preamble \usepackage{ifdraft} \newcommand{\plot}[1]{\ifdraft{\includegraphics{#1.pdf}}{\input{#1.pgf}}} % somewhere in your document \plot{example_plot}Now when you give your
\documentclassthe optiondraft, a placeholder of the correct size is rendered instead of the PGF plot. Note that for this to work you need to keep the preview PDF generated bytexfig.savefigin addition to the corresponding PGF file in the same directory.
Contact
TexFig was created and is maintained by Nils Leif Fischer.
License
TexFig is released under the MIT license. See LICENSE.md for details.