
Visualization of GW190412
A visualization I created in 2020 with Python and ParaView, published under the MIT license.
Widely publicized renderings of the first unequal-mass and precessing gravitational-wave event measured by LIGO and Virgo on Apr 12, 2019.
From README.md in the nilsvu/gw190412-movie GitHub repository:
![]()

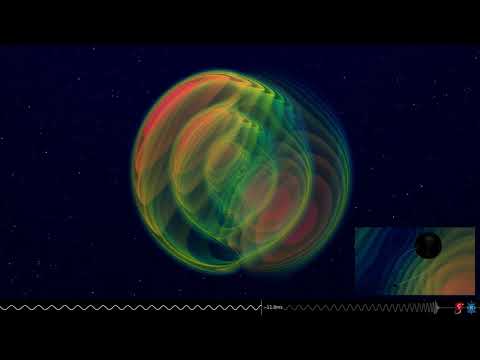
Visualization of the GW190412 gravitational-wave signal
Numerical simulation of two black holes that inspiral and merge, emitting gravitational waves. One black hole is 3.5x more massive than the other and spins, which makes the orbit precess. The simulated gravitational-wave signal is consistent with the observation made by the LIGO and Virgo gravitational-wave detectors on April 12th, 2019 (GW190412).
-
Video:
- More information and images available at: https://www.aei.mpg.de/214403/gw190412-binary-black-hole-merger and https://dcc.ligo.org/LIGO-G2000575/public
- Credit: N. Fischer, H. Pfeiffer, A. Buonanno (Max Planck Institute for Gravitational Physics), Simulating eXtreme Spacetimes (SXS) Collaboration
- Selected media coverage:
- https://www.nature.com/articles/d41586-020-01153-7
- https://www.sciencenews.org/article/gravitational-waves-unevenly-sized-black-holes-ligo-virgo
- https://www.aei.mpg.de/213678/a-signal-like-none-before
- https://www.ligo.org/detections/GW190412
- https://www.ligo.caltech.edu/news/ligo20200420
- https://www.spektrum.de/news/neuartiges-gravitationswellensignal/1725506
Details on the visualization
- The „apparent horizon“ of the black holes in the simulation are shown in black. At 1:09 the simulation finds an enveloping apparent horizon that signals the two black holes have merged.
- The coloring on the horizons represents their deformation. Specifically, it shows the two-dimensional Ricci scalar on the surface. White arrows indicate the direction of the black hole’s spin.
- The gravitational radiation is translated to colors around the black holes. The colors transition from blue, representing weak radiation, to red, representing strong radiation. Specifically, the coloring represents the real part of the gravitational wave strain with its inverse radial scaling removed for visualization. The strain is computed from the simulation’s extrapolated waveform, which is shown at the bottom of the screen.
- The simulation was performed with the SpEC numerical relativity code by the Simulating eXtreme Spacetimes (SXS) Collaboration.
- The visualization is based on the gwpv code, using the ParaView scientific visualization toolkit.